
Last modified July 7, 2026
LogQL query reference
This page is a reference catalog of LogQL query patterns for analyzing logs on the Giant Swarm Observability Platform. Each entry pairs a query with the result it produces against a real cluster, so you can adapt it to your own logs.
To open Grafana Explore, select the Loki data source, and choose the builder or code query mode, see the data exploration guide. For the complete language specification, see the Grafana Loki LogQL documentation.
Query examples with results
Here are real LogQL queries executed against a Giant Swarm cluster with their actual results:
Multi-label filtering
Query logs from a specific cluster and service:
Query:
{cluster_id="myCluster", scrape_job="kubernetes-pods", service_name="nginx"}
Sample Result:
100.64.193.223 - - [01/Jul/2025:15:30:06 +0000]  400 "POST /loki/api/v1/push HTTP/1.1" 2459 "-" "Alloy/v1.9.0 (linux; helm)" "3.9.58.214"
100.64.193.223 - - [01/Jul/2025:15:30:05 +0000]  400 "POST /loki/api/v1/push HTTP/1.1" 2458 "-" "Alloy/v1.9.0 (linux; helm)" "3.9.58.214"
100.64.192.119 - - [01/Jul/2025:15:30:05 +0000]  400 "POST /loki/api/v1/push HTTP/1.1" 2458 "-" "Alloy/v1.9.0 (linux; helm)" "3.9.58.214"
This is also called a log stream selector, regex can also be used to match labels, see the Grafana - Log stream selector for more details.
Error and warning detection
Filter logs for specific error patterns across a cluster:
Query:
{cluster_id="myCluster", scrape_job="kubernetes-pods", service_name="nginx"} |~ `(?i)error|failed|warning`
Sample Results:
100.64.106.205 - - [01/Jul/2025:14:38:17 +0000]  499 "GET /loki/api/v1/query_range?direction=backward&end=1751380695823000000&query=xxxxxxxxxx&start=1751380395000000000&step=1000ms HTTP/1.1" 0 "-" "Grafana/12.0.0+security-01" "-"
100.64.106.205 - - [01/Jul/2025:14:38:15 +0000]  499 "GET /loki/api/v1/query_range?direction=backward&end=1751380692390000000&query=xxxxxxxxxx&start=1751359080000000000&step=60000ms HTTP/1.1" 0 "-" "Grafana/12.0.0+security-01" "-"
This query uses a regex to match log lines containing error, failed, or warning. The (?i) makes the regex case-insensitive. See the Grafana - Line filter expression for more details.
Log volume metrics
Query:
sum(count_over_time({cluster_id="myCluster", scrape_job="kubernetes-pods", service_name="nginx"}[1h]))
Sample Results:
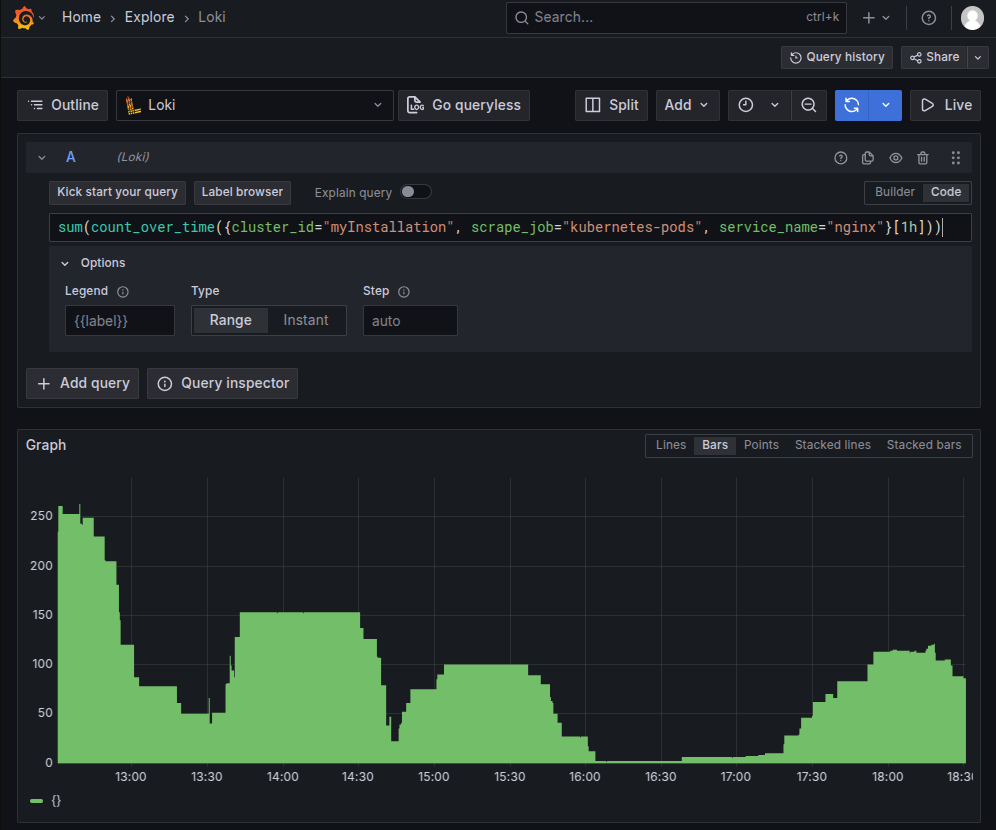
This shows the volume of logs per hour helping identify spikes or drops in log activity. More details can be found in the Grafana - LogQL.
Advanced filtering techniques
Extracting patterns from application logs
Parse and filter on any pattern structures found in application logs, here Nginx access logs:
Query:
{cluster_id="myInstallation", scrape_job="kubernetes-pods", container="nginx"}
| pattern `<ip> - - [<_>]  <status> "<method> <uri> <_>" <size> <_> "<agent>" <_>`
| status < 200 or status > 299
Sample Results:
100.12.345.67 - - [01/Jul/2025:15:11:16 +0000]  400 "GET /nonexistent HTTP/1.1" 58 "-" "curl/8.14.1" "-"
100.12.345.67 - - [01/Jul/2025:15:11:14 +0000]  400 "GET /dummy HTTP/1.1" 58 "-" "curl/8.14.1" "-"
100.12.345.67 - - [01/Jul/2025:15:08:35 +0000]  101 "GET /loki/api/v1/tail?query=%7Bstream%3D%22stdout%22%2Cpod%3D%22loki-canary-86b869b45c-2t68n%22%7D+ HTTP/1.1" 959409 "-" "Go-http-client/1.1" "-"
100.12.345.67 - - [01/Jul/2025:14:58:20 +0000]  101 "GET /loki/api/v1/tail?query=%7Bstream%3D%22stdout%22%2Cpod%3D%22loki-canary-86b869b45c-92bxq%22%7D+ HTTP/1.1" 960163 "-" "Go-http-client/1.1" "-"
Different parsers can be used to extract structured data from logs, such as json, logfmt, regex, or unpack. The choice depends on the log format and your specific needs. See the Grafana Loki LogQL documentation for more details.
Dynamic field extraction with line formatting
Extract specific fields and create custom log output formats:
Query:
{cluster_id="myCluster", pod=~"observability-operator-.*"}
| json
| controller="cluster"
| line_format "{{.ts}} [{{.level}}] {{.namespace}}/{{.name}}: {{.msg}}"
Sample Results:
2025-07-01T14:02:29Z [info] monitoring/myInstallation: alloy-service - ensured alloy is configured
2025-07-01T14:02:29Z [info] monitoring/myInstallation: alloy-service - current number of shards
2025-07-01T14:02:29Z [info] monitoring/myInstallation: alloy-service - ensuring alloy is configured
2025-07-01T14:02:29Z [info] monitoring/myInstallation: application is configured successfully
2025-07-01T14:02:29Z [info] monitoring/myInstallation: configure application
This allows you to format log lines for better readability and focus on relevant information. The line_format function is powerful for customizing log output. See the Grafana - Line format expression for more details.
Performance monitoring with log metrics
Error rate calculation
Generate metrics to track error rates across services:
Query:
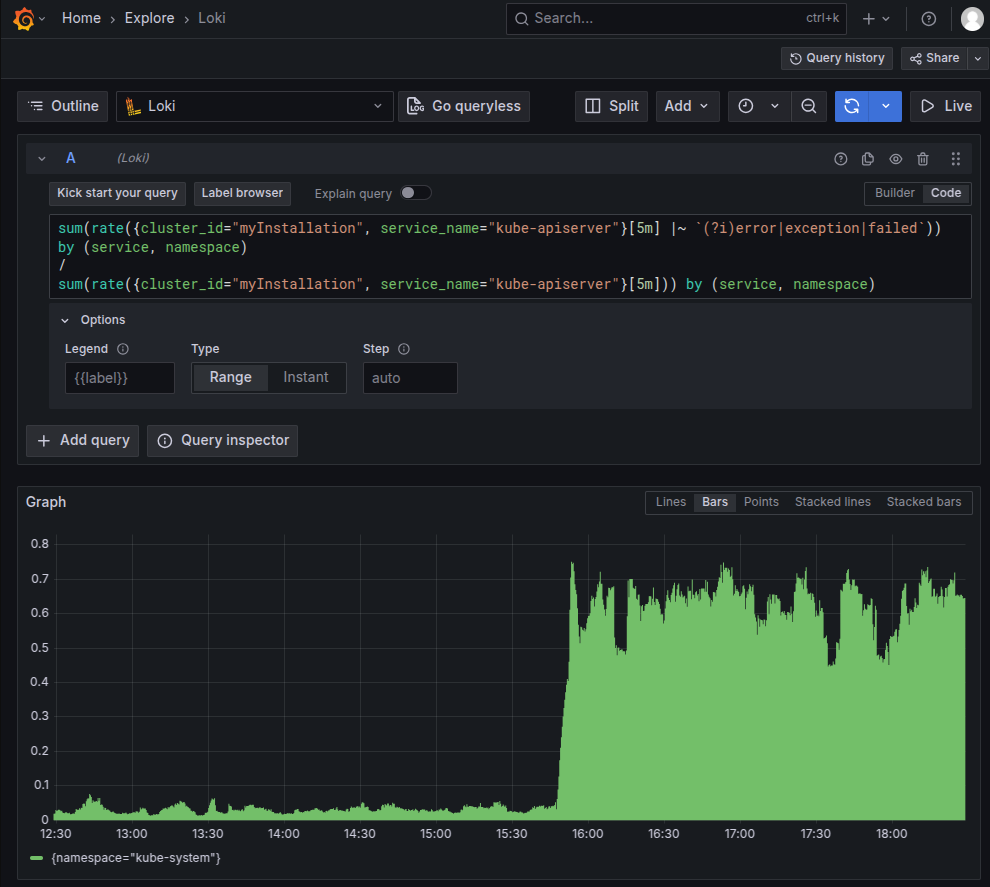
sum(rate({cluster_id="myInstallation", service_name="kube-apiserver"}[5m] |~ `(?i)error|exception|failed`)) by (service, namespace)
/
sum(rate({cluster_id="myInstallation", service_name="kube-apiserver"}[5m])) by (service, namespace)
Sample Results:
Request latency analysis from access logs
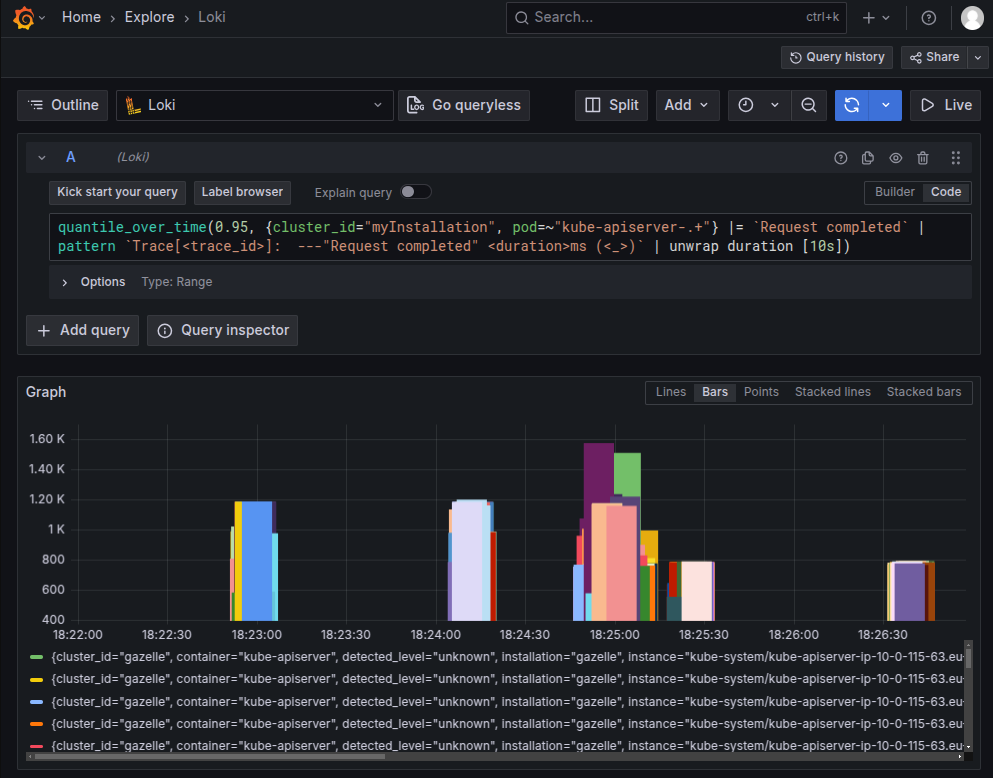
Extract latency metrics from application access logs:
Query:
quantile_over_time(0.95,
  {cluster_id="myInstallation", pod=~"kube-apiserver-.+"}
  |= `Request completed`
  | pattern `Trace[<trace_id>]:  ---"Request completed" <duration>ms (<_>)`
  | unwrap duration [10s]
)
Sample Results:
System-level troubleshooting
Node resource monitoring
Analyze system logs for resource pressure indicators:
Query:
{cluster_id="myCluster", scrape_job="system-logs"}
| json
| SYSLOG_IDENTIFIER="kernel"
|~ `Out of memory|oom-kill|Memory cgroup out of memory`
| line_format `{{.node}} - {{.MESSAGE}}`
Sample Results:
ip-10-0-204-71 - kube-state-metr invoked oom-killer: gfp_mask=0xcc0(GFP_KERNEL), order=0, oom_score_adj=994
ip-10-0-204-71 - Memory cgroup out of memory: Killed process 105294 (kube-state-metr) total-vm:1159412kB, anon-rss:429324kB, file-rss:27104kB, shmem-rss:0kB, UID:65534 pgtables:996kB oom_score_adj:994
Best practices for advanced LogQL
- Use specific label selectors to reduce query scope and improve performance
- Leverage regex filtering with
|~before applying expensive operations likejson - Combine log stream selectors strategically to balance specificity and coverage
- Apply time ranges appropriate to your use case to optimize query performance
- Use line formatting to create readable output for complex queries
See also
For comprehensive LogQL syntax and additional functions, refer to:
Related pages on the Giant Swarm platform:
- Data exploration: how to access Grafana and select the Loki data source
- Dashboard creation: visualize your log queries in dashboards
Need help, got feedback?
We listen to your Slack support channel. You can also reach us at support@giantswarm.io. And of course, we welcome your pull requests!