Creating a Grafana organization
Step-by-step guide to create and configure Grafana organizations for multi-tenant observability.
This guide walks you through creating and configuring Grafana organizations to implement multi-tenancy in your observability platform.
Prerequisites
Before creating your organization, make sure you have:
- Access to the management cluster, where you can create custom resources
- Identified the tenant names you want to use
- Configured groups for RBAC in your identity provider
Understanding default organizations
Before creating your own organizations, it’s helpful to know about the two that already exist:
- Shared Org: Your starting point with system dashboards and platform metrics (uses
giantswarmtenant) - Giant Swarm: Internal organization for platform operations (Giant Swarm staff only)
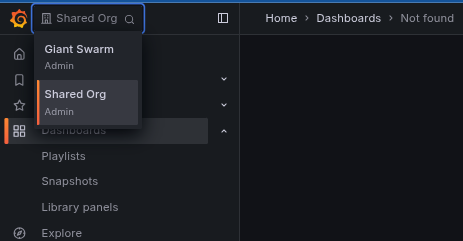
Your organizations will appear alongside the Shared Org in the organization dropdown. Learn more about these in our multi-tenancy overview.
Creating a Grafana organization
Create a GrafanaOrganization custom resource in the management cluster:
Basic example
This example shows a simple organization for a single application with role-based access for different teams:
apiVersion: observability.giantswarm.io/v1alpha1
kind: GrafanaOrganization
metadata:
  name: myonlineshop
spec:
  displayName: MyOnlineShop
  rbac:
    admins:
    - customer:platform-admin
    - customer:ops-team
    editors:
    - customer:development-team
    - customer:devops-team
    viewers:
    - customer:marketing-team
    - customer:business-analysts
  tenants:
  - myonlineshop
Configuration options
| Field | Description | Required |
|---|---|---|
metadata.name | Kubernetes resource name (follows DNS naming rules) | Yes |
spec.displayName | Human-readable name shown in Grafana UI | Yes |
spec.rbac.admins | Groups with full organization access | Yes |
spec.rbac.editors | Groups that can create/edit dashboards and alerts | No |
spec.rbac.viewers | Groups with read-only access | No |
spec.tenants | List of tenant names this organization can access | Yes |
Advanced examples
Multi-environment organization:
This example demonstrates an organization that manages multiple environments with hierarchical access control:
apiVersion: observability.giantswarm.io/v1alpha1
kind: GrafanaOrganization
metadata:
  name: engineering-team
spec:
  displayName: Engineering Team
  rbac:
    admins:
    - customer:engineering-leads
    editors:
    - customer:senior-engineers
    - customer:devops-team
    viewers:
    - customer:junior-engineers
    - customer:qa-team
  tenants:
  - prod-frontend
  - prod-backend
  - staging-frontend
  - staging-backend
Production-only organization:
This example shows a restricted organization with access only to production data:
apiVersion: observability.giantswarm.io/v1alpha1
kind: GrafanaOrganization
metadata:
  name: production-monitoring
spec:
  displayName: Production Monitoring
  rbac:
    admins:
    - customer:sre-team
    - customer:platform-admin
    viewers:
    - customer:engineering-team
    - customer:support-team
  tenants:
  - production
RBAC configuration
The RBAC section maps identity provider groups to Grafana organization roles:
| Role | Permissions |
|---|---|
| Admin | Full organization access: manage users, datasources, dashboards, and settings |
| Editor | Create and edit dashboards, alerts, and folders (cannot manage users) |
| Viewer | Read-only access to dashboards and data |
Group format
Most Giant Swarm installations use Dex as the identity provider. Specify groups using the format {dex-connector-id}:{group-name}:
rbac:
  admins:
  - customer:platform-admin        # Maps 'platform-admin' group from 'customer' connector
  - customer:ops-team
  editors:
  - customer:development-team
  viewers:
  - customer:support-team
Finding your connector ID: Check your cluster’s Dex configuration for the connector ID (usually customer).
Required fields: admins is mandatory; editors and viewers are optional.
What happens when you create an organization
Creating a GrafanaOrganization resource automatically provisions:
- New Grafana organization with your specified display name
- Tenant-scoped datasources for Loki, Mimir, and Alertmanager
- User role assignments based on your RBAC configuration
- Data collection of alerts, metrics and logs
Verification steps
After creating your organization:
- Check organization status:
kubectl get grafanaorganization myonlineshop -o yaml
2. [**Log in to Grafana**](/tutorials/observability/data-exploration/accessing-grafana/) and verify:
- The organization dropdown menu on the top-left corner shows all expected organizations
- You can [explore and query data](/tutorials/observability/data-exploration/) for each of your tenants
- Logged-in users have appropriate role assignments under the `Administration / Users and access / Users` section